Nasdaq Market Symmetry:
How Repetition Reveals
Trading Edge
Last week’s price action showed near-identical buying points—here’s what to learn from it.
I want to show you something… a quick observation from last week’s intraday action on the Nasdaq.
Let’s take a look…
MARKET SYMMETRY


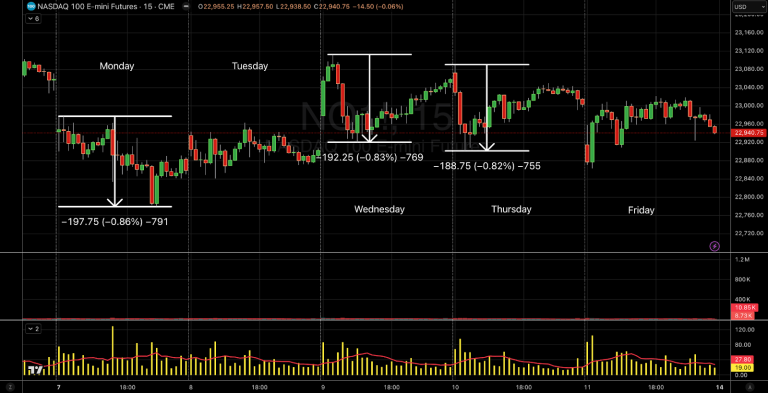
Take a look at the Nasdaq RTH chart above ![]()
![]()
What do you notice?
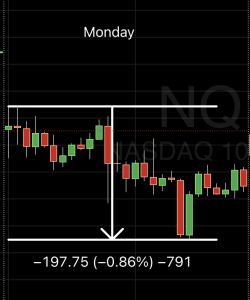
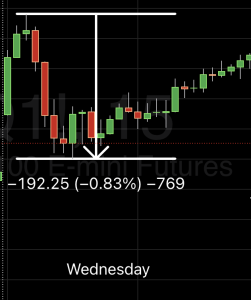
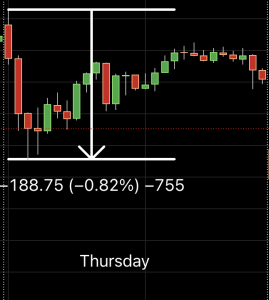
On the three largest range days, Monday, Wednesday, and Thursday, buyers stepped in almost exactly the same distance from the high.
![]()
![]()
![]()
![]()


![]()
![]()
![]()
![]()


![]()
![]()
![]()
![]()


What’s up with this? Some magic indicator?
Yep – yours for just $999 (joke, joke! ![]()
![]()
Well, for whatever reason, buyers are seeing that level as a decent discount to get aggressive.
And yeah… It’s uncanny how tight the symmetry is. (All within $11, which is basically noise on Nas, right?)
So, what can we take from this as traders?
Whichever market you trade, it pays to start paying attention to symmetry:
![]()
![]()
![]()
![]()
![]()
![]()
![]()
![]()
It’s not magic. It’s not a holy grail.
But it does help anchor your risk and highlight high-probability trade zones.
All you’re doing is studying recent behaviour… then using it to shape your game plan for the day ahead.
It brings structure to the chaos… a quiet way to stack edge in your favour.
Home » Nasdaq Market Symmetry: How Repetition Reveals Trading Edge
